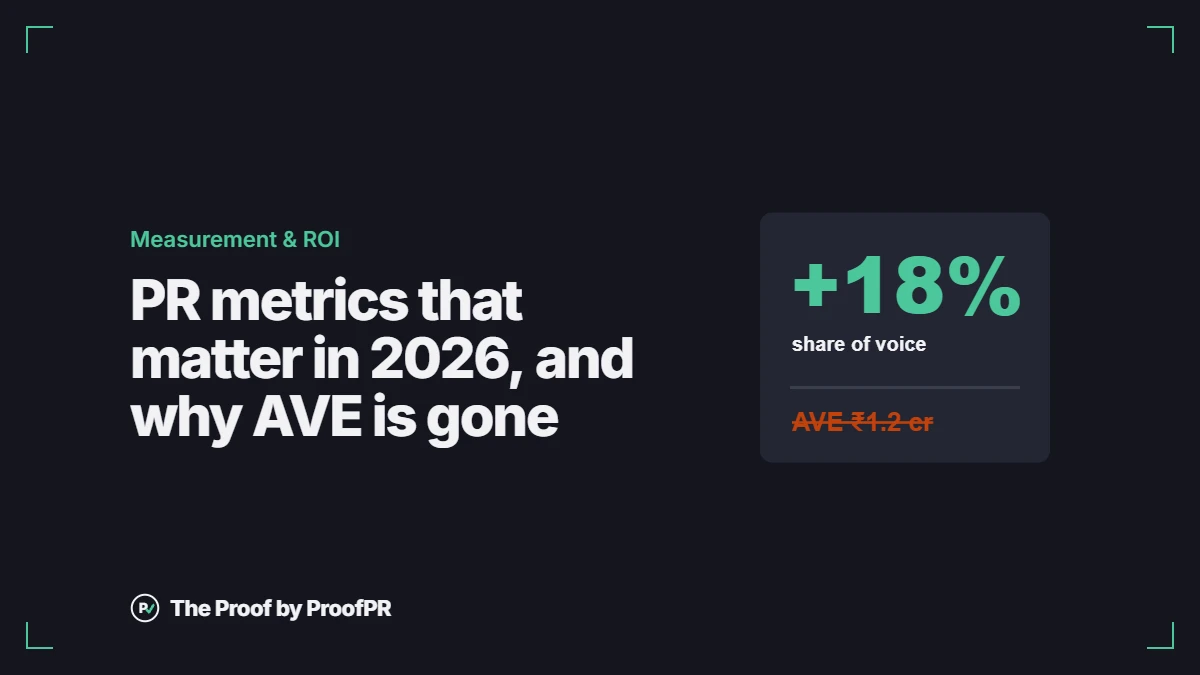
For years, many PR reports in India ended with one big number: the advertising value equivalency, or AVE. “This coverage would have cost ₹1.2 crore as advertising.” Clients liked it because it was large. Measurement professionals have long rejected it because it says nothing about what the coverage achieved.
This guide covers the PR metrics that replace it, what each one tells you, and how often to report it.
Why AVE no longer works
AMEC, the global association for communication measurement, published the Barcelona Principles in 2010 and updated them in 2015 and again in 2020 (version 3.0). Every version says the same thing about AVE: it is not the value of communication. A story’s value depends on who read it, what it said and what they did next, not on the price of the same space as an ad.
If a client still asks for AVE, show it last and explain what it does not measure.
In practice, CFOs and marketing heads increasingly see through it too. A number that can’t be linked to anything the business cares about weakens the rest of the report.
Output metrics: what you produced
These are the basics. They don’t prove impact, but they show the work and make trends visible.
- Stories and publications: count original stories and syndicated pickups separately.
- Tier mix: how many stories ran in the titles the client’s audience actually reads.
- Spokesperson coverage: how often each spokesperson was quoted, useful when building a founder’s profile.
Outtake metrics: what the audience got
These measure whether the coverage said what you wanted it to say.
- Message pull-through: the share of stories that carried each key message. It is the metric clients understand fastest; see how to score message pull-through.
- Share of voice: your client’s share of coverage against named competitors on the topics that matter. See how to calculate share of voice.
- Sentiment and accuracy: whether stories were positive, neutral or negative, and whether facts were right.
Key takeaway
Pick one outtake metric as the headline number and show its trend every month.
Outcome metrics: what changed
These link PR to the business and usually need data from the client.
- Direct traffic and branded search during a campaign
- Referral traffic from coverage links
- Inbound leads, demo requests or job applications that mention a story
- Investor or partner conversations started by coverage
Agree up front which outcome you will track and who supplies the data. One honest outcome metric beats a dashboard of guesses.
The new metric: AI visibility
Buyers increasingly ask ChatGPT, Gemini, Claude or Perplexity before they search, and Google shows AI Overviews above its results in India. These assistants learn from published sources, including news coverage. So a newer question for PR is: when someone asks an AI assistant about your client’s category, is the client named, and is what it says accurate?
We cover this in what AI visibility is and why PR teams should care. You can also get a free AI snapshot of any brand to see what one assistant says today.
A simple monthly set
- Stories, publications and tier mix (output)
- Message pull-through for two or three key messages (outtake)
- Share of voice against two named competitors (outtake)
- One agreed business outcome (outcome)
- Quarterly: what AI assistants say about the brand
That is enough to show what PR did, without a single made-up rupee figure.